This is the view of the Reports tab, after selecting a class to view from the dropdown menu:
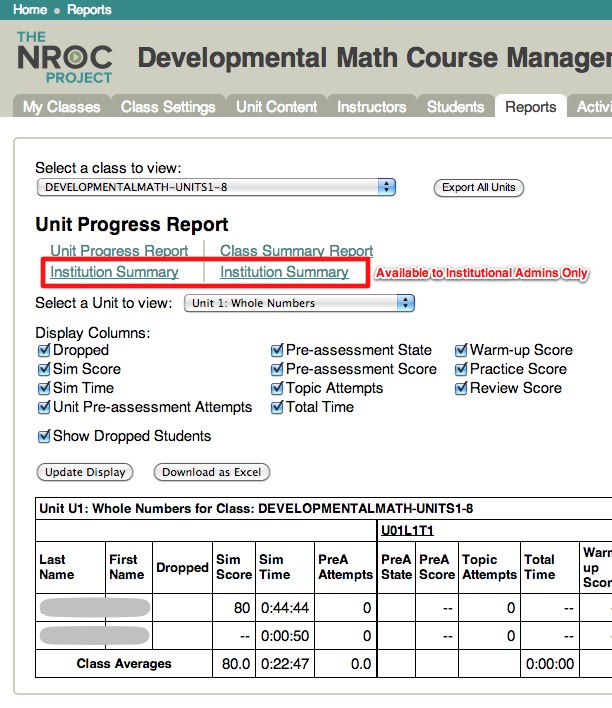
Only Administrators have access to the Institution-level reports.
Select a Unit to View
Choose a unit from the drop down list. The display will refresh automatically. The default view is Unit Progress Report.
Unit Progress Report
Display Columns
Customize display on the page by unchecking boxes. Click "Update Display" to refresh the screen with your choices enabled. The following table shows which checkbox is associated with which column in the report.
| Checkbox | Report Column |
| Dropped | Dropped |
| Sim Score | Sim Score |
| Sim Time | Sim Time |
| Unit Pre-Assessment Attempts | PreA Attempts |
| Pre-Assessment State | PreA State |
| Topic Attempts | Attempts |
| Total Time | Total Time |
| Pre-Assessment Score | PreA Score |
| Practice Score | Practice Score |
| Warm-up Score | Warm-up Score |
| Review Score | Review Score |
| Show Dropped Students | (eliminates dropped students from the display) |
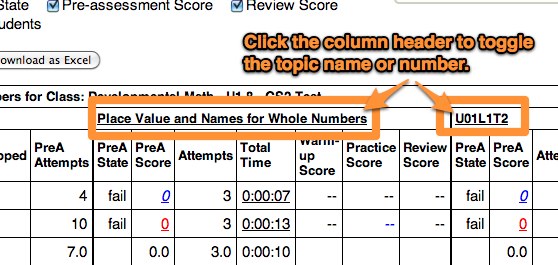
You can also adjust the view by clicking column headers to toggle between the topic name and number.
The number represents the Unit (U), Lesson (L) and Topic (T)
For example: U01L1T2 = Unit 01, Lesson 1, Topic 2.
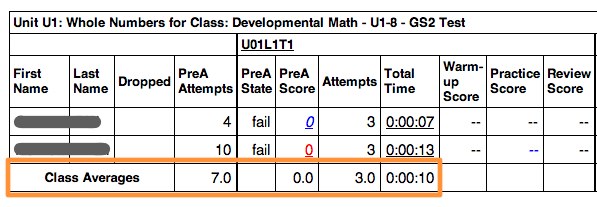
Class Averages
Class averages are displayed in the report for:
- number of PreAssessment attempts
- PreAssessment score
- topic attempts
- total time
Sim Score / Sim Time
The tutor simulation score (as a percent), along with the time spent on the simulation, is reported for each unit.
The Overall Simulation Score is calculated with two variables as follows:
- MaxPossible is determined by the number of decision point stages the student has viewed.
- CurrentScore is determined by the summation of the choices chosen by the student (correct = 1 pt, incorrect = 0 pt)
The score is reported as a percent:
Score = CurrentScore/MaxPossible * 100
The score depends on number of questions, and some sims have more questions than others.
Download Options
There are two download options on this tab: Export All Units and Download to Excel.
Export All Units - a monolithic report of all data for all units in the course chosen from the dropdown menu.
Download to Excel - a report on the unit selected, as displayed on screen. Any unchecked boxes will NOT be included in the report. Before downloading, be sure to click Update Display after checking or checking boxes, so that your report reflects your choices.
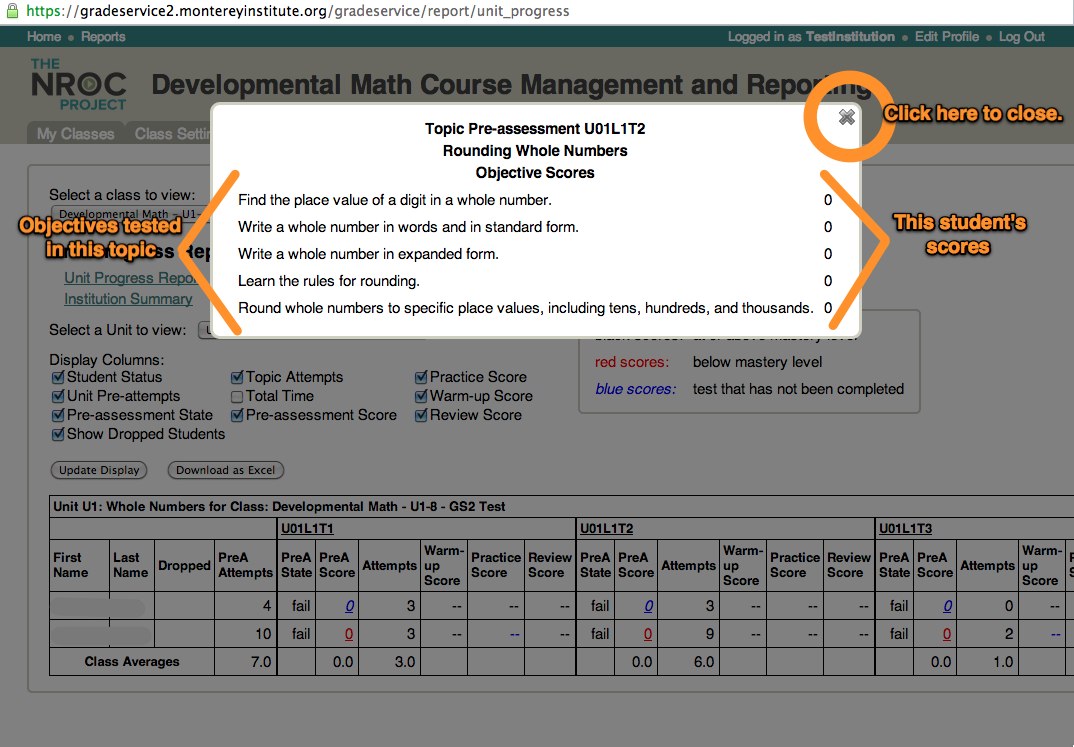
PreAssessment Topic Objective Scores
For a detailed view of a particular student's score, click one of the red or blue numbers. You will see a list of the objectives for the topic, along with the student's score on each objective.
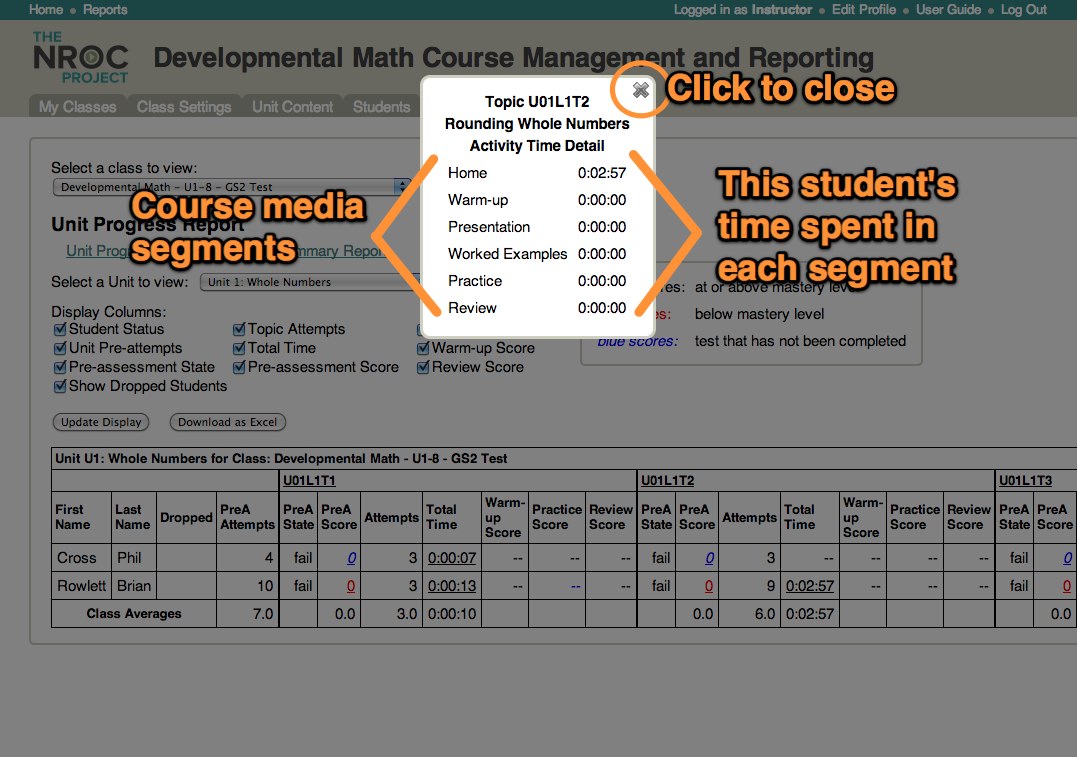
Topic Activity Time Detail
You can see more detail about a student's time spent in a topic by clicking the underlined time in the Total Time column. You will see the course media segments broken out, with the time the student's browser was open to that content (in hours:minutes:seconds).
NOTE: We can only report how long the browser was open. There is no way to track the student's actual engagement with the material. The instructor will need to use discernment in how to evaluate these reports.
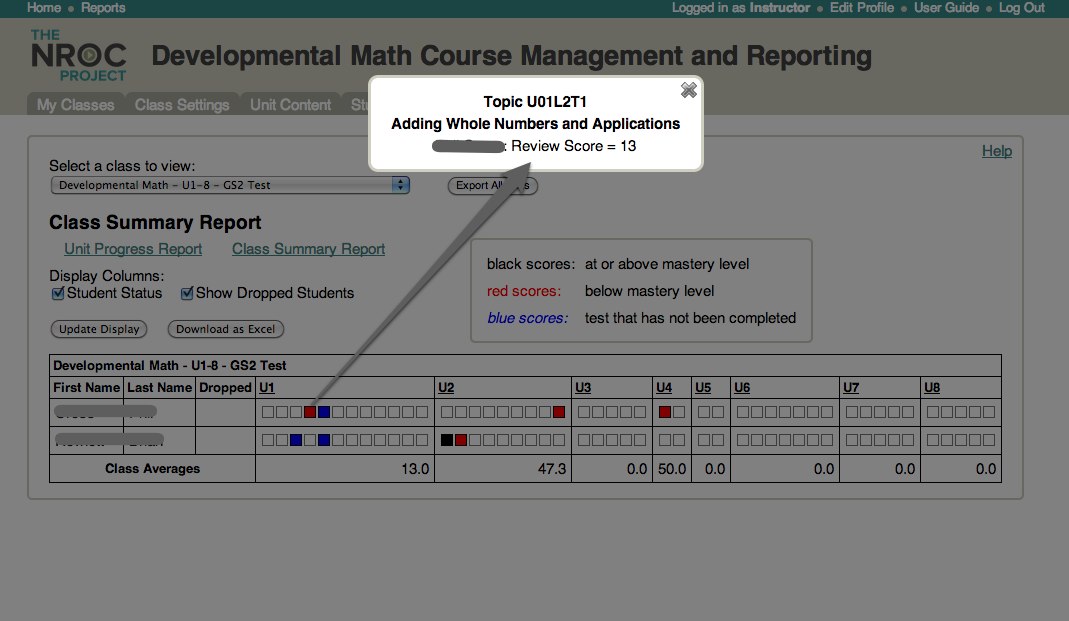
Class Summary Report
The Class Summary Report provides a graphical representation of each student's progress through the units. Like the Unit Progress Reports, individual units can be downloaded in Excel format, or the entire summary report can be exported.
To see details for any student's progress, click the red, blue or black box.
Comments